Last Updated on January 2, 2019 by Admin
3.4.1.2 Lab – Using Wireshark to View Network Traffic Answers
Lab – Using Wireshark to View Network Traffic (Answers Version – Optional Lab)
Answers Note: Red font color or gray highlights indicate text that appears in the Answers copy only. Optional activities are designed to enhance understanding and/or to provide additional practice.
Topology

3.4.1.2 Lab – Using Wireshark to View Network Traffic Answers 001
Objectives
Part 1: Capture and Analyze Local ICMP Data in Wireshark
Part 2: Capture and Analyze Remote ICMP Data in Wireshark
Background / Scenario
Wireshark is a software protocol analyzer, or “packet sniffer” application, used for network troubleshooting, analysis, software and protocol development, and education. As data streams travel back and forth over the network, the sniffer “captures” each protocol data unit (PDU) and can decode and analyze its content according to the appropriate RFC or other specifications.
Wireshark is a useful tool for anyone working with networks and can be used with most labs in the CCNA courses for data analysis and troubleshooting. In this lab, you will use Wireshark to capture ICMP data packet IP addresses and Ethernet frame MAC addresses.
Required Resources
- 1 PC (Windows 7, 8, or 10 with internet access)
- Additional PCs on a local-area network (LAN) will be used to reply to ping requests.
Answers Note: This lab assumes that the student is using a PC with internet access and can ping other PCs on the local area network.
Using a packet sniffer such as Wireshark may be considered a breach of the security policy of the school. It is recommended that permission be obtained before running Wireshark for this lab. If using a packet sniffer such as Wireshark is an issue, the Answers may wish to assign the lab as homework or perform a walk-through demonstration.
Part 1: Capture and Analyze Local ICMP Data in Wireshark
In Part 1 of this lab, you will ping another PC on the LAN and capture ICMP requests and replies in Wireshark. You will also look inside the frames captured for specific information. This analysis should help to clarify how packet headers are used to transport data to their destination.
Step 1: Retrieve your PC interface addresses.
For this lab, you will need to retrieve your PC IP address and its network interface card (NIC) physical address, also called the MAC address.
- Open a command window, type ipconfig /all, and then press Enter.
- Note the IP address of your PC interface, its description, and its MAC (physical) address.

3.4.1.2 Lab – Using Wireshark to View Network Traffic Answers 002
- Ask a team member or team members for their PC IP address and provide your PC IP address to them. Do not provide them with your MAC address at this time.
Step 2: Start Wireshark and begin capturing data.
- On your PC, click the Windows Start button to see Wireshark listed as one of the programs on the pop-up menu. Double-click Wireshark.
- After Wireshark starts, click the capture interface to be used. Because we are using the wired Ethernet connection on the PC, make sure the Ethernet option is on the top of the list.

3.4.1.2 Lab – Using Wireshark to View Network Traffic Answers 003
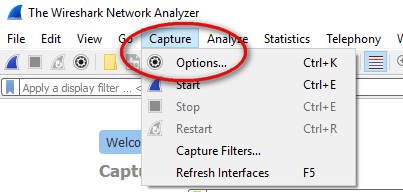
You can manage the capture interface by clicking Capture and Options:
- A list of interfaces will display. Make sure the capture interface is checked under Promiscuous.

3.4.1.2 Lab – Using Wireshark to View Network Traffic Answers 004
Note: We can further manage the interfaces on the PC by clicking Manage Interfaces. Verify that the description matches what you noted in Step 1b. Close the Manage Interfaces window after verifying the correct interface.

3.4.1.2 Lab – Using Wireshark to View Network Traffic Answers 005
- After you have checked the correct interface, click Start to start the data capture.

3.4.1.2 Lab – Using Wireshark to View Network Traffic Answers 006
Note: You can also start the data capture by clicking the Wireshark icon in the main interface.
 Information will start scrolling down the top section in Wireshark. The data lines will appear in different colors based on protocol.
3.4.1.2 Lab – Using Wireshark to View Network Traffic Answers 007
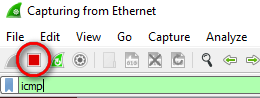
- This information can scroll by very quickly depending on what communication is taking place between your PC and the LAN. We can apply a filter to make it easier to view and work with the data that is being captured by Wireshark. For this lab, we are only interested in displaying ICMP (ping) PDUs. Type icmp in the Filter box at the top of Wireshark and press Enter or click on the Apply button (arrow sign) to view only ICMP (ping) PDUs.

3.4.1.2 Lab – Using Wireshark to View Network Traffic Answers 008
- This filter causes all data in the top window to disappear, but you are still capturing the traffic on the interface. Bring up the command prompt window that you opened earlier and ping the IP address that you received from your team member.

3.4.1.2 Lab – Using Wireshark to View Network Traffic Answers 009
Notice that you start seeing data appear in the top window of Wireshark again.

3.4.1.2 Lab – Using Wireshark to View Network Traffic Answers 010
Note: If the PC of your team member does not reply to your pings, this may be because the PC firewall of the team member is blocking these requests. Please see Appendix A: Allowing ICMP Traffic Through a Firewall for information on how to allow ICMP traffic through the firewall using Windows 7.
- Stop capturing data by clicking the Stop Capture icon.

Step 3: Examine the captured data.
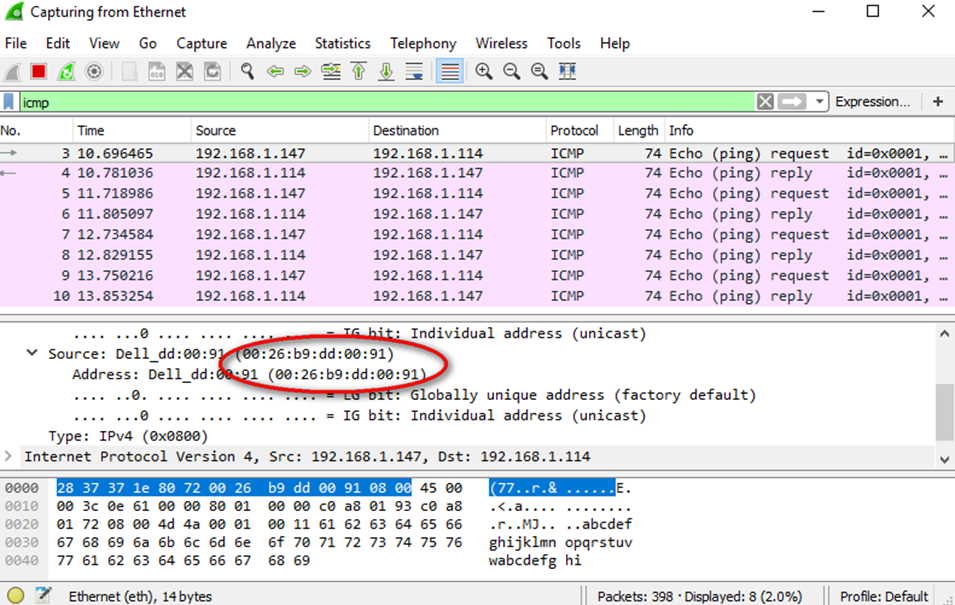
In Step 3, examine the data that was generated by the ping requests of your team member PC. Wireshark data is displayed in three sections: 1) The top section displays the list of PDU frames captured with a summary of the IP packet information listed; 2) the middle section lists PDU information for the frame selected in the top part of the screen and separates a captured PDU frame by its protocol layers; and 3) the bottom section displays the raw data of each layer. The raw data is displayed in both hexadecimal and decimal form.

3.4.1.2 Lab – Using Wireshark to View Network Traffic Answers 011
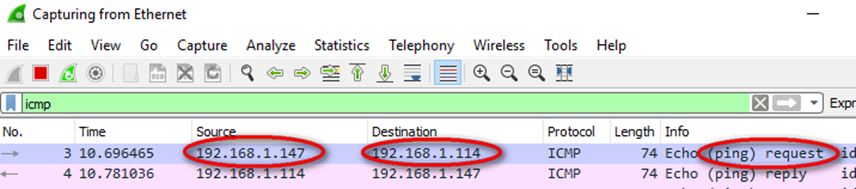
- Click the first ICMP request PDU frames in the top section of Wireshark. Notice that the Source column has your PC IP address, and the Destination column contains the IP address of the teammate PC that you pinged.
- With this PDU frame still selected in the top section, navigate to the middle section. Click the plus sign to the left of the Ethernet II row to view the destination and source MAC addresses.
Does the source MAC address match your PC interface (shown in Step 1.b)? ______ Yes
Does the destination MAC address in Wireshark match your team member MAC address?
_____ Yes
How is the MAC address of the pinged PC obtained by your PC?
___________________________________________________________________________________
The MAC address is obtained through an ARP request.
Note: In the preceding example of a captured ICMP request, ICMP data is encapsulated inside an IPv4 packet PDU (IPv4 header) which is then encapsulated in an Ethernet II frame PDU (Ethernet II header) for transmission on the LAN.
Part 2: Capture and Analyze Remote ICMP Data in Wireshark
In Part 2, you will ping remote hosts (hosts not on the LAN) and examine the generated data from those pings. You will then determine what is different about this data from the data examined in Part 1.
Step 1: Start capturing data on the interface.
- Start the data capture again.

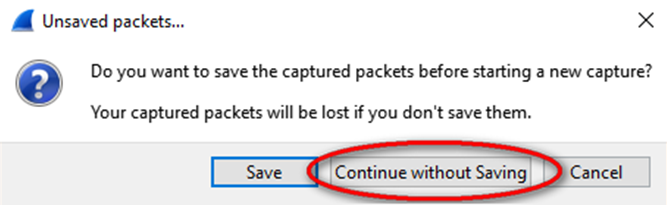
- A window prompts you to save the previously captured data before starting another capture. It is not necessary to save this data. Click Continue without Saving.
- With the capture active, ping the following three website URLs:
- www.yahoo.com
- www.cisco.com
- www.google.com
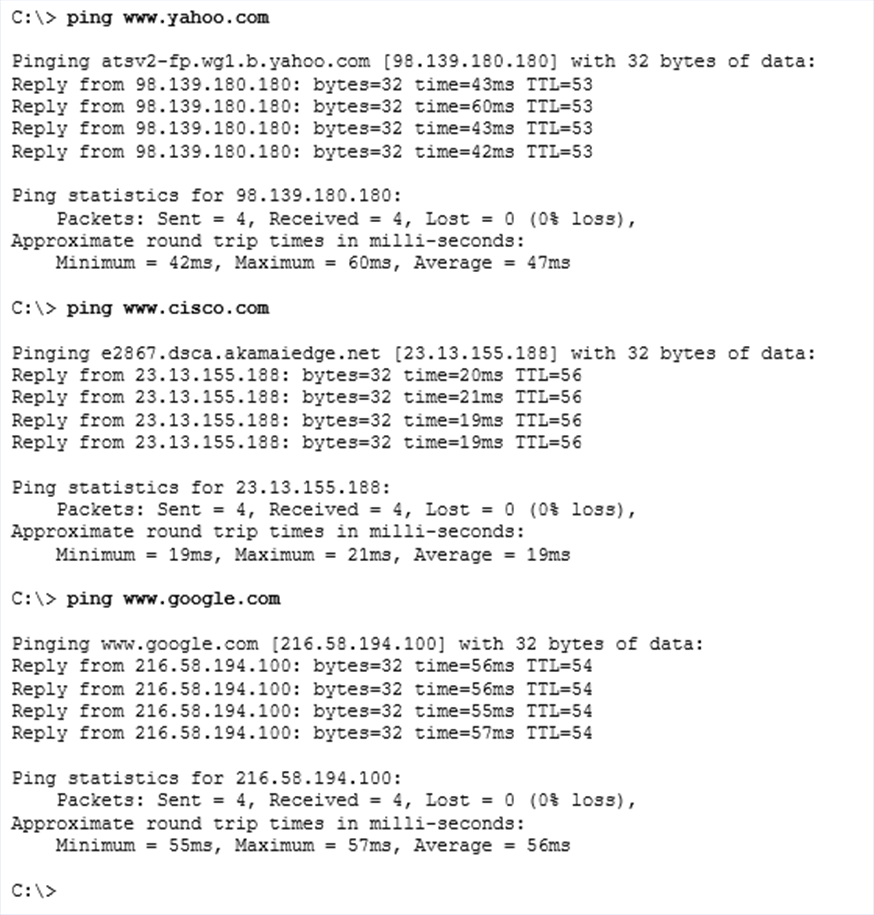 Note: When you ping the URLs listed, notice that the Domain Name Server (DNS) translates the URL to an IP address. Note the IP address received for each URL.
- You can stop capturing data by clicking the Stop Capture icon.
Step 2: Examining and analyzing the data from the remote hosts.
- Review the captured data in Wireshark and examine the IP and MAC addresses of the three locations that you pinged. List the destination IP and MAC addresses for all three locations in the space provided.
1st Location: IP: _____._____._____._____ MAC: ____:____:____:____:____:____
2nd Location: IP: _____._____._____._____ MAC: ____:____:____:____:____:____
3rd Location: IP: _____._____._____._____ MAC: ____:____:____:____:____:____
IP addresses: 98.139.180.180, 23.13.155.188, 216.58.194.100 (these IP addresses may vary)
MAC address: This will be the same for all three locations. It is the physical address of the default-gateway LAN interface of the router. - What is significant about this information?
____________________________________________________________________________________
The MAC addresses for all three locations are the same. - How does this information differ from the local ping information you received in Part 1?
________________________________________________________________________________________________________________________________________________________________________
A ping to a local host returns the MAC address of the PC NIC. A ping to a remote host returns the MAC address of the default gateway LAN interface.
Reflection
Why does Wireshark show the actual MAC address of the local hosts, but not the actual MAC address for the remote hosts?
______________________________________________________________________________________________________________________________________________________________________________
MAC addresses for remote hosts are not known on the local network, so the MAC address of the default-gateway is used. After the packet reaches the default-gateway router, the Layer 2 information is stripped from the packet and a new Layer 2 header is attached with the destination MAC address of the next hop router.
Appendix A: Allowing ICMP Traffic Through a Firewall
If the members of your team are unable to ping your PC, the firewall may be blocking those requests. This appendix describes how to create a rule in the firewall to allow ping requests. It also describes how to disable the new ICMP rule after you have completed the lab.
Step 1: Create a new inbound rule allowing ICMP traffic through the firewall.
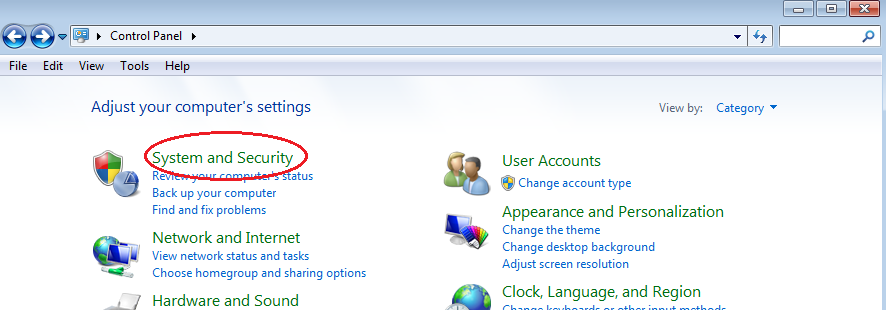
- From the Control Panel, click the System and Security option.
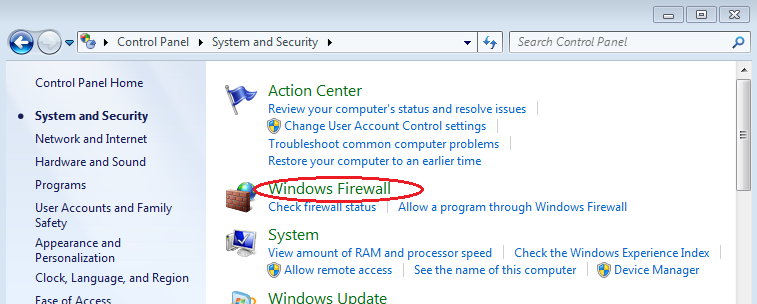
- From the System and Security window, click Windows Firewall.
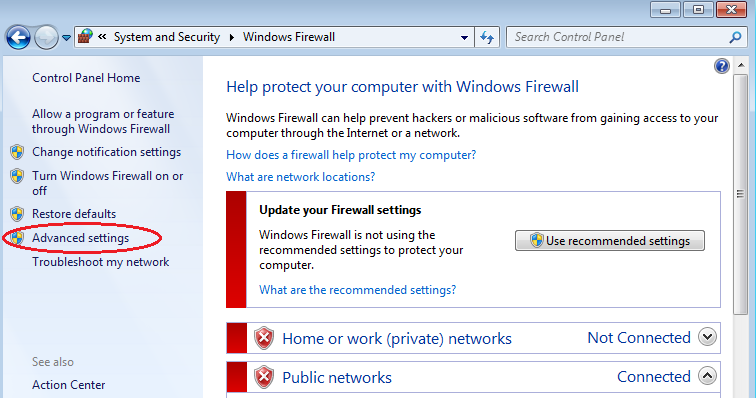
- In the left pane of the Windows Firewall window, click Advanced settings.
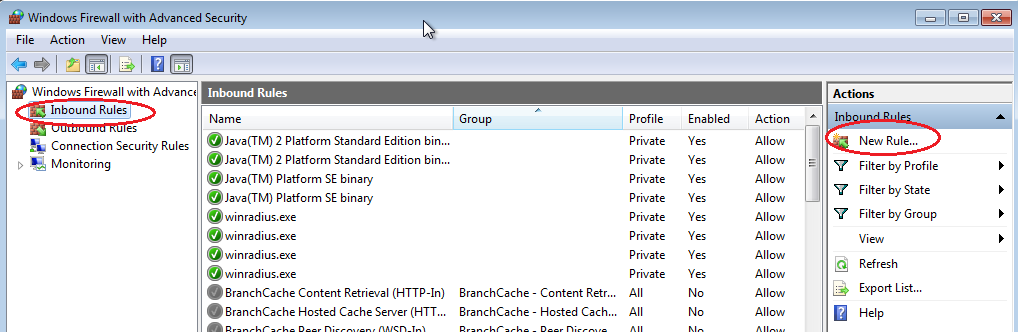
- On the Advanced Security window, choose the Inbound Rules option on the left sidebar and then click New Rule… on the right sidebar.
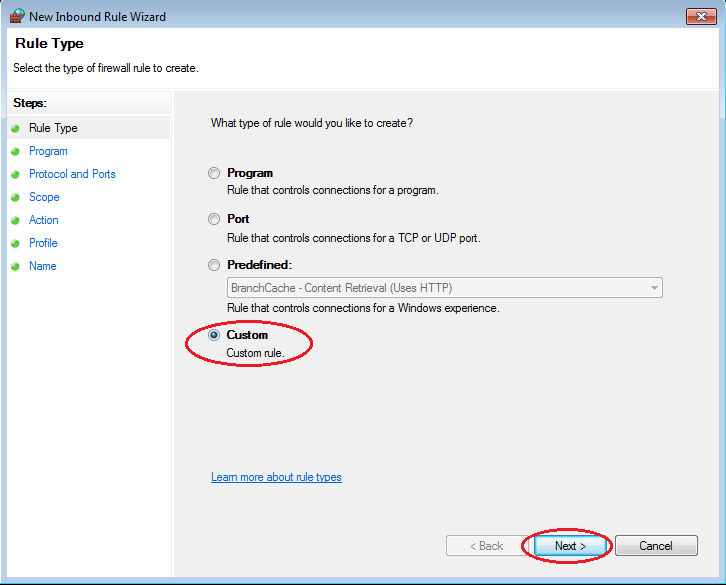
- This launches the New Inbound Rule wizard. On the Rule Type screen, click the Custom radio button and click Next
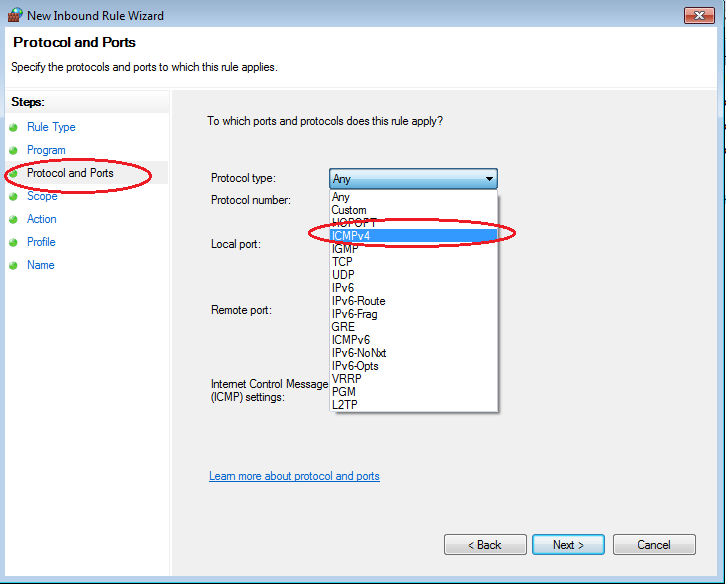
- In the left pane, click the Protocol and Ports option and using the Protocol Type drop-down menu, select ICMPv4, and then click Next.
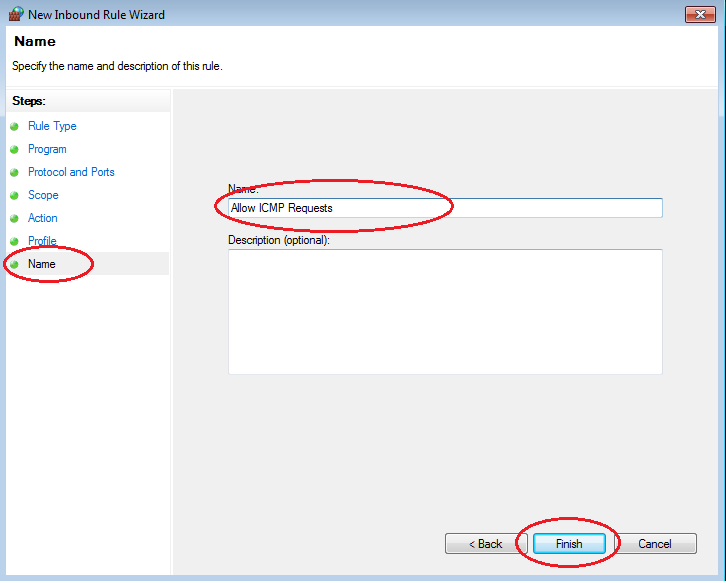
- In the left pane, click the Name option and in the Name field, type Allow ICMP Requests. Click Finish.
 This new rule should allow your team members to receive ping replies from your PC.
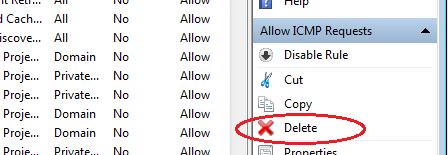
Step 2: Disabling or deleting the new ICMP rule.
After the lab is complete, you may want to disable or even delete the new rule you created in Step 1. Using the Disable Rule option allows you to enable the rule again at a later date. Deleting the rule permanently deletes it from the list of inbound rules.
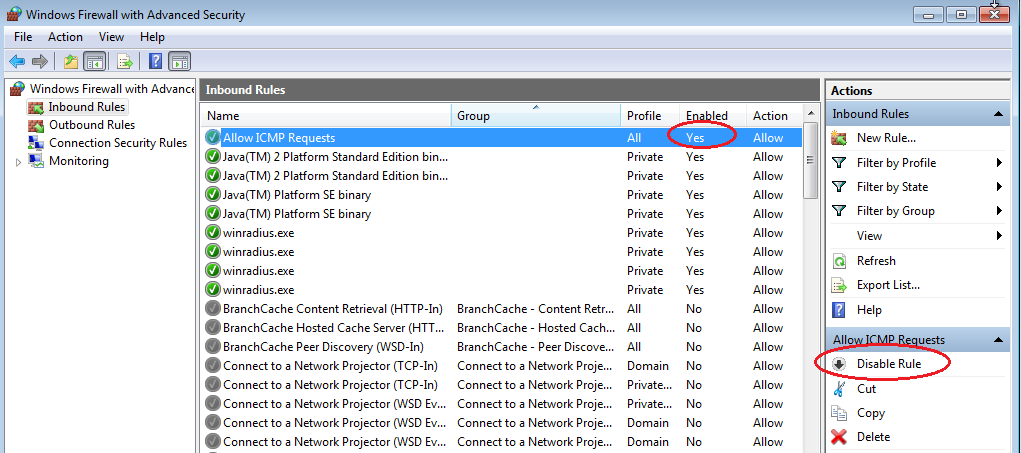
- On the Advanced Security window, click Inbound Rules in the left pane and then locate the rule you created in Step 1.
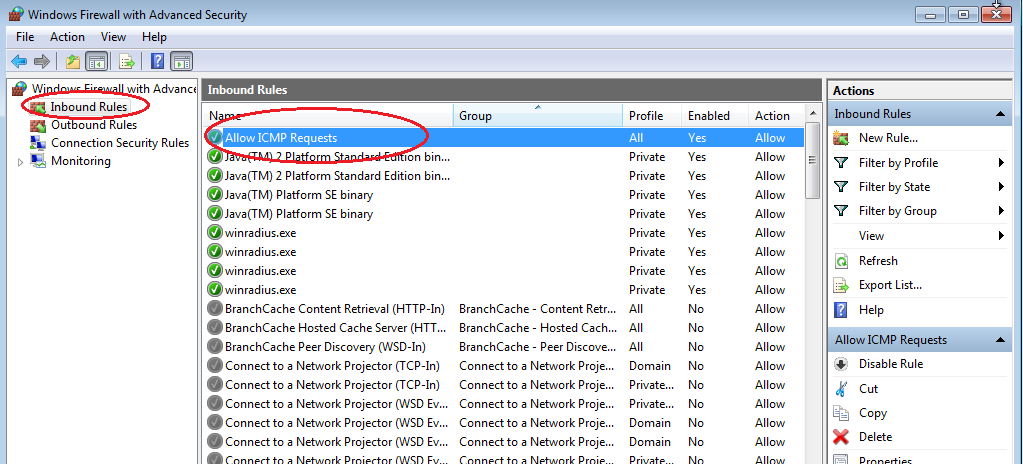
- To disable the rule, click the Disable Rule option. When you choose this option, you will see this option change to Enable Rule. You can toggle back and forth between Disable Rule and Enable Rule; the status of the rule also shows in the Enabled column of the Inbound Rules list.
- To permanently delete the ICMP rule, click Delete. If you choose this option, you must re-create the rule again to allow ICMP replies.